First day of the year
3 minute read
I've been struggling to reply to people promptly lately, and often forgetting altogether.
decision making
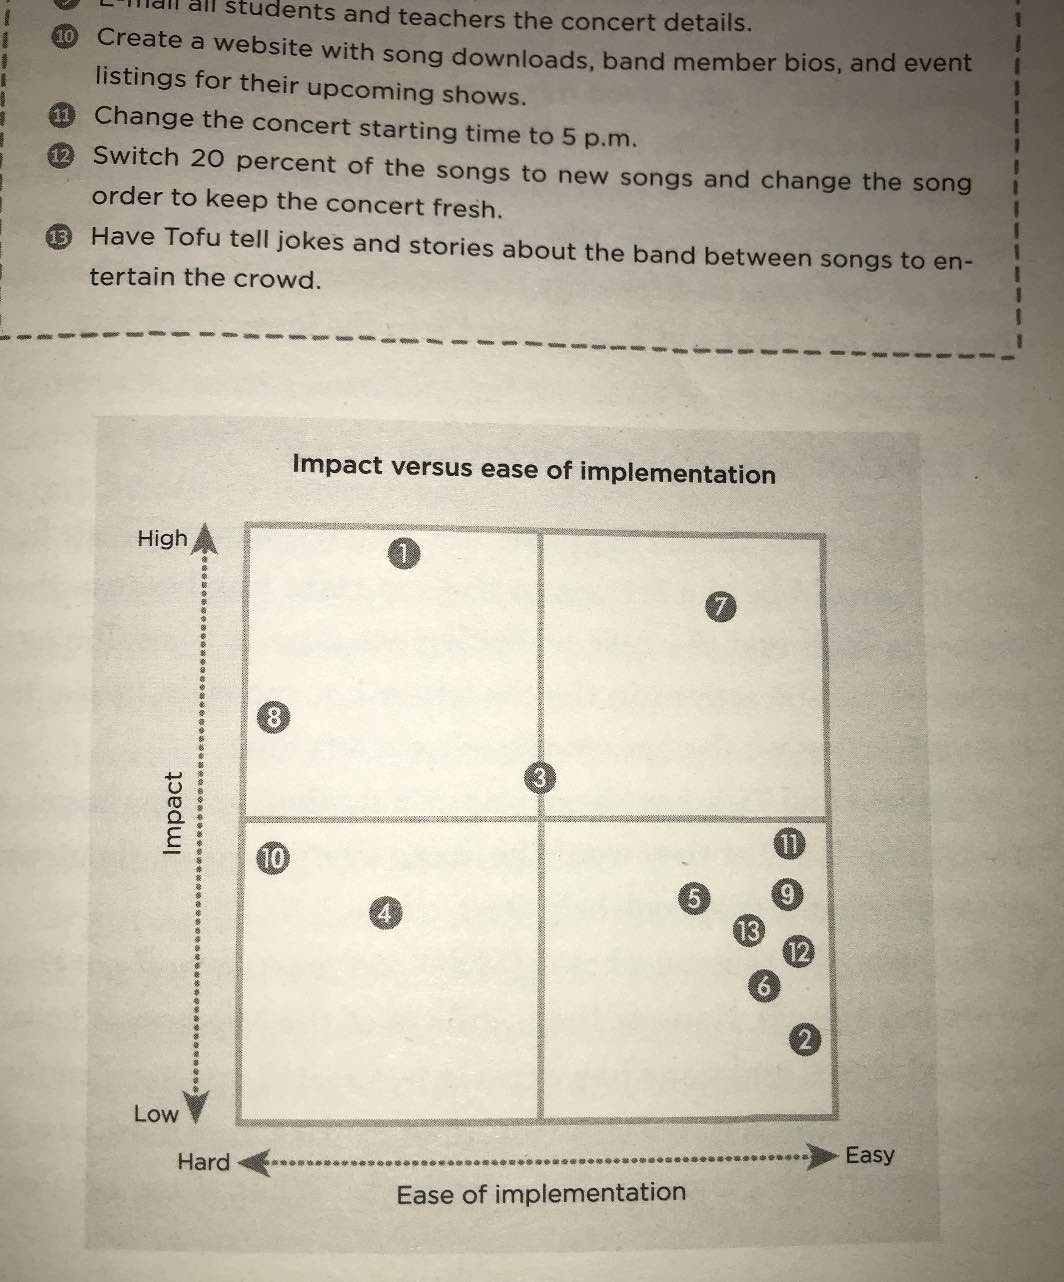
I read the rest of the book about problem solving but I'm yet to apply it to the timekeeping issue. I think I'll use a logic tree to break the problem up into different areas, then another one to generate some solutions. For now I'm using pompom as a reminder and TTT to log my time, more as a step in the right direction than a real solution. One thing I really liked in the book is the use of matrices to help visualise options.

The book is a bit hard to read because it's written like a bad childrens story, but the tools presented are pretty useful. I've started writing them out in my paper journal, and I intend to do little examples to help me learn.
So far it looks like this:
# Problem Solving, Ken Watanabe
** tools **
- Logic Tree
- Yes/No Tree
- Problem Solving Design Plan
- Hypothesis Pyramid
- Pros and Cons: Criteria and Evaluation

**graphs**
- Matrices for evaluating options
- Pie Graphs for data analysis
This all seems pretty basic, but:
- I haven't really done it in the past for any decisions
- I have suffered a lot over decision making
I think having these tools, even just as concepts to refer to, will help a lot.
The "graphs" title seems silly, but I didn't know what to call them at the time. Perhaps "visual information tools"? Edward Tufte must be rolling in his grave.
The times that I do externalise my info in numbers I often just eyeball them. Using actual graphs could (should) be more intuitive and helpful. I'll extend this list a little more and it can be a useful jumping-off point when I'm collecting information.
ttt
TTT is a bash script and a log.txt file. I've added the bash script as an executable to my PATH variable so I can call it anywhere.
For logging what I'm doing now I would call ttt journal
and it would add a line like this to log.txt
2023/01/09 12:56:35 journal
For a project I might call ttt project-name specific-task other-task, or for general activities I might call ttt reading topic blog.
I can use as many descriptors as I like, and I'm generous with my descriptions. I want see what patterns emerge over time, seeing the data from above.
Of course the biggest challenge right now is remembering to do it.
Here's the bash script:
parent_path=$( cd "$(dirname "${BASH_SOURCE[0]}")" ; pwd -P )
cd "$parent_path"

dt=$(date '+%Y/%m/%d %H:%M:%S')
words="$*"
echo $dt $words  >> log.txt
arc
I gave Arc a go last night. It's a new browser, "Arc is your space to breathe on the internet."
What it does new and special is:
- rearrange the workspace to give the page itself primacy,
- provide better tools and augmentation of webapps and site.
- Manage tabs better
The url/search bar isn't at the top of the screen, but off to the side. The browser is no longer an extended google search engine.
It really feels like a browser that's made for the contemporary web and how we use it. It makes me excited to make browser based tools, knowing I can easily incorporate them into my workflow.
It also gave me a fun little membership card:

what else
Here's some tabs I've had open, in various states of being read or referred to:
- Becoming Sponge: Sustaining Practice Through Protocols of Web Publishing
- Jack Clarks AI newsletter
- Tech Interview Handbook
- JS Unit Testing Guide
- The Simpler Way
I've got a 50% wholemeal sourdough loaf in the oven as we speak read write.
listening to
Some Dream - Koreless Remix by Perfume Genius and Koreless
questions
- How can I reduce the time I leave my friends and family waiting for a response?
- What decisions am I struggling to make at the moment that could be helped with some decision making tools?